|
|
R-Plot Version 2.0 |
|
|
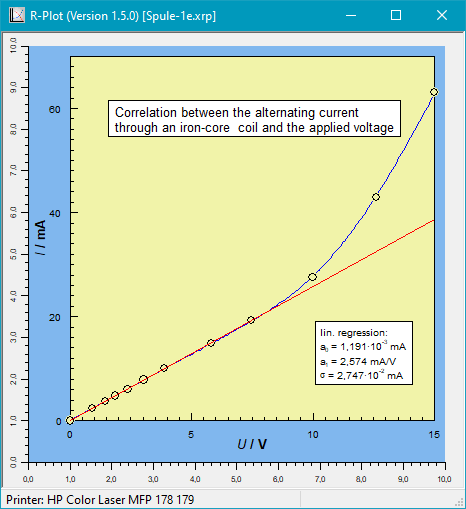
The sample at the right shows some measurement points having a linear correlation
up to a certain voltage. The regression line is computed only for this sub-range.
Inside the box the gradient (a1), intercept (a0),
and standard deviation are displayed in their respective units.
The points are connected by a spline function.
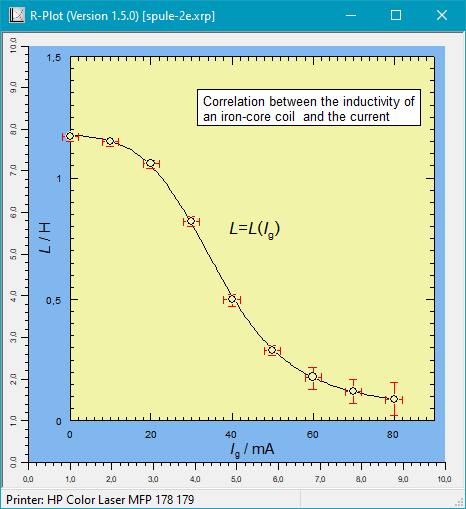
The measurement points in the sample at the right are connected by a spline function. In addition the error bars are displayed. Error bars smaller than the symbols at the data points are not visible.
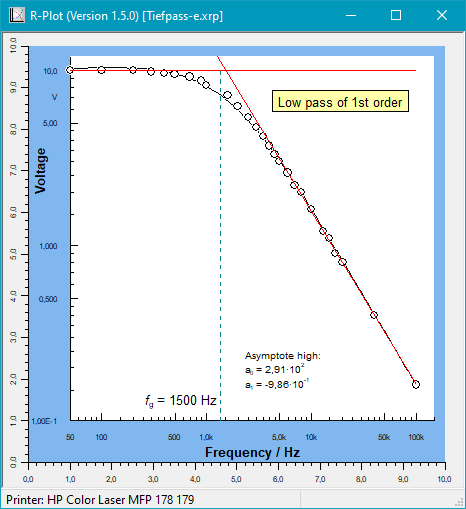
In a low-pass filter the frequency response converges for high frequencies to an asymptote which can be computed by a linear regression using the double-logarithmic scale in the range 5 kHz .. 100 kHz. The calculated gradient of the asymptote is displayed below (theoretical value = -1).
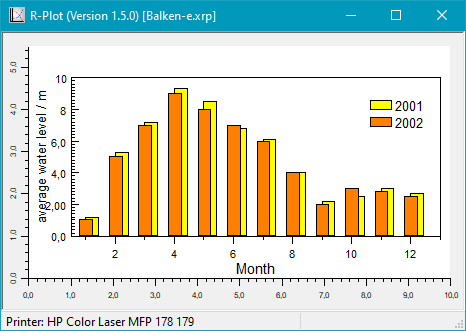
The sample chart displays some fictitious monthly data as bar chart for two years. At the upper right shows the legends of the two data sets.
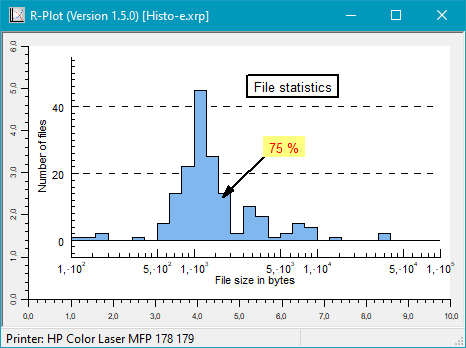
The histogram shows the distribution of the size of 167 files in a half-logarithmic scale. 75% of all files are smaller than the value the arrow points to.